On-Die Power Rail Measurements: Setup and Best Practices
Accurate on-die power rail measurements depend on proper sense-line design, differential probing, and careful test setup at the package level.
Accurate on-die power rail measurements depend on proper sense-line design, differential probing, and careful test setup at the package level.

Transmission line losses—driven by skin effect and dielectric properties—play a critical role in degrading high-speed signal integrity and eye performance.
Transmission line loss directly affects eye diagram quality, with around −12 dB at Nyquist marking the limit before signal integrity rapidly degrades without equalization.
Standard IEEE pulse definitions can misinterpret fast-decaying ESD pulses, requiring manual threshold adjustments for accurate measurements.


The IEEE's pulse definitions, found in the organization's Std 181-2011 that covers transitions, pulses, and related waveforms, set the bar for how pulse measurements are determined. These definitions, which are in the DNA of all oscilloscopes, are just the thing for measuring repetitive pulses such as clock signals but not so much for ESD/EMC measurement requirements. In this post, we'll discuss why that is and what you should do differently for measuring ESD pulses.
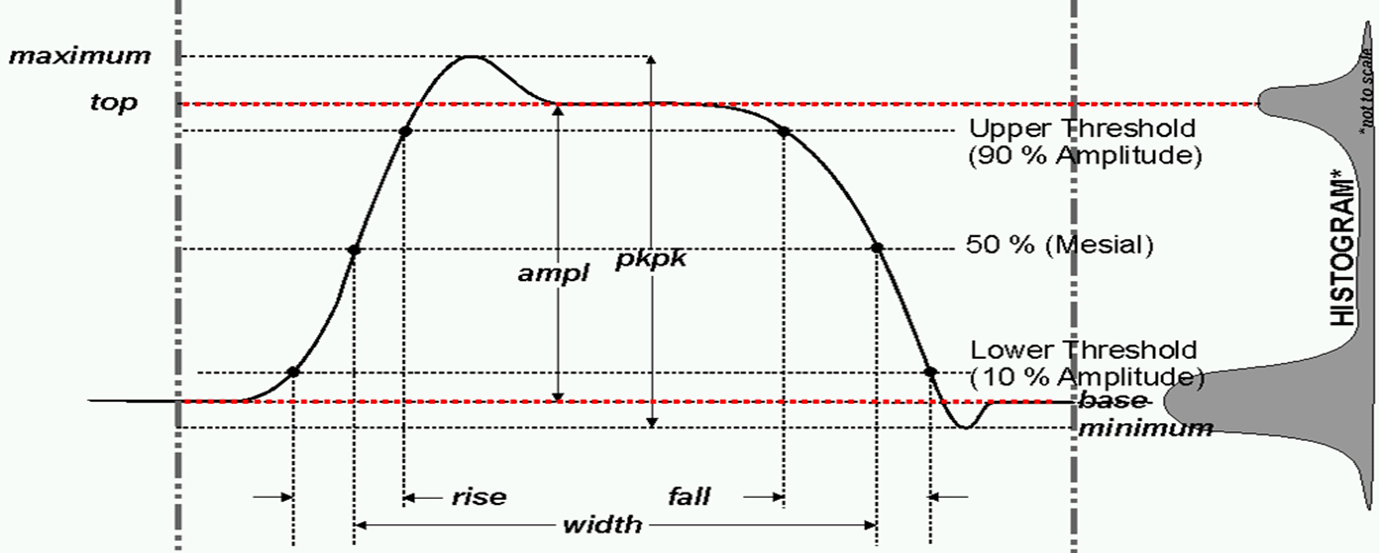
When oscilloscopes measure pulses, the IEEE definition requires them to measure the top and base of the waveform (Figure 1). You can see why when you take into account the histogram of a typical pulse. The top and base give you the steady-state high and low values, which is what you're typically looking for when you measure something like a clock pulse.
The top and base of the waveform are determined statistically based on the two modes of the voltage histogram and are represented by the red lines in Figure 1. Those top and base levels form the 100% and 0% reference levels, respectively, which are used for measurements such as: amplitude, rise/fall times, period, frequency, width, duty cycle, overshoot, and virtually every timing measurement. If the top and base are not calculated correctly, timing and amplitude measurements will suffer.
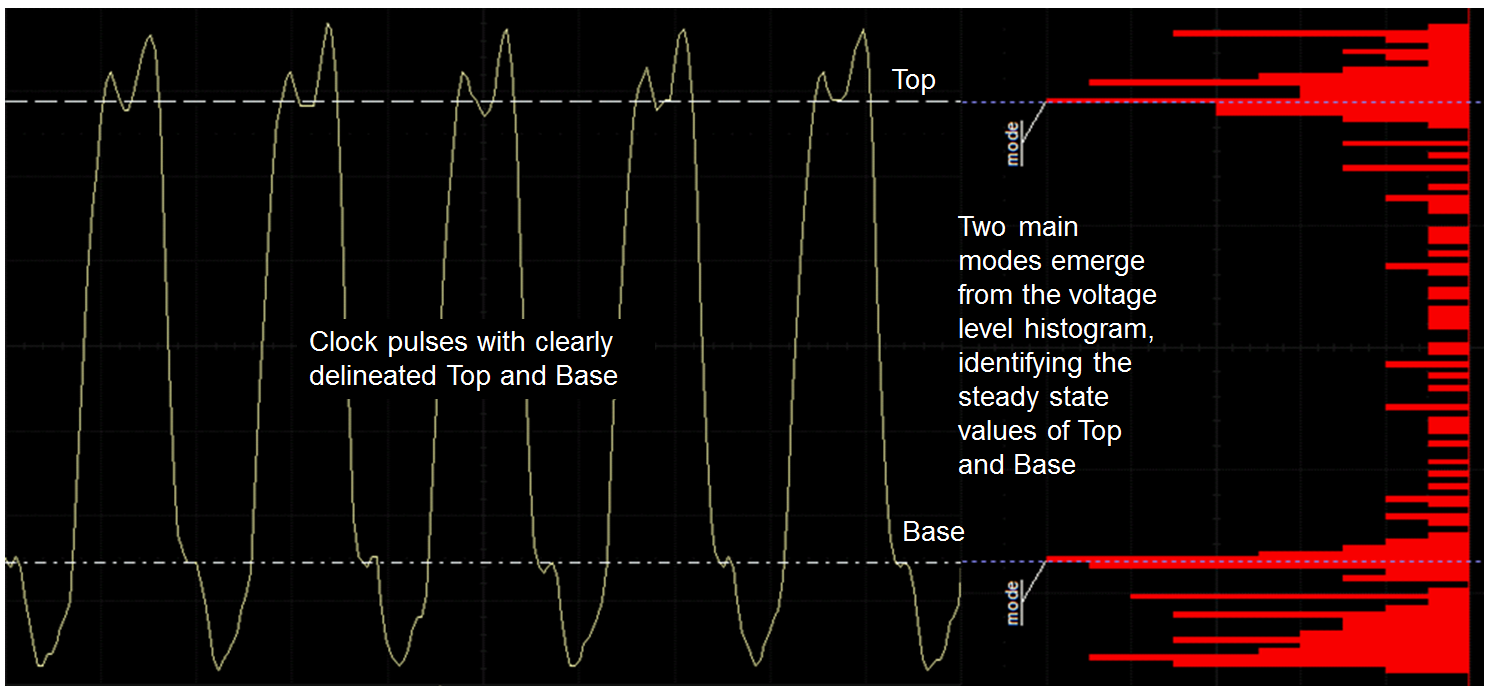
Figure 2 shows how a clock signal's top and base are correctly determined from a voltage histogram. The image shows a real clock signal with the histogram superimposed on the Y axis. We can clearly see the two main modes as labeled in the image, which denote the steady-state values of the top and base.
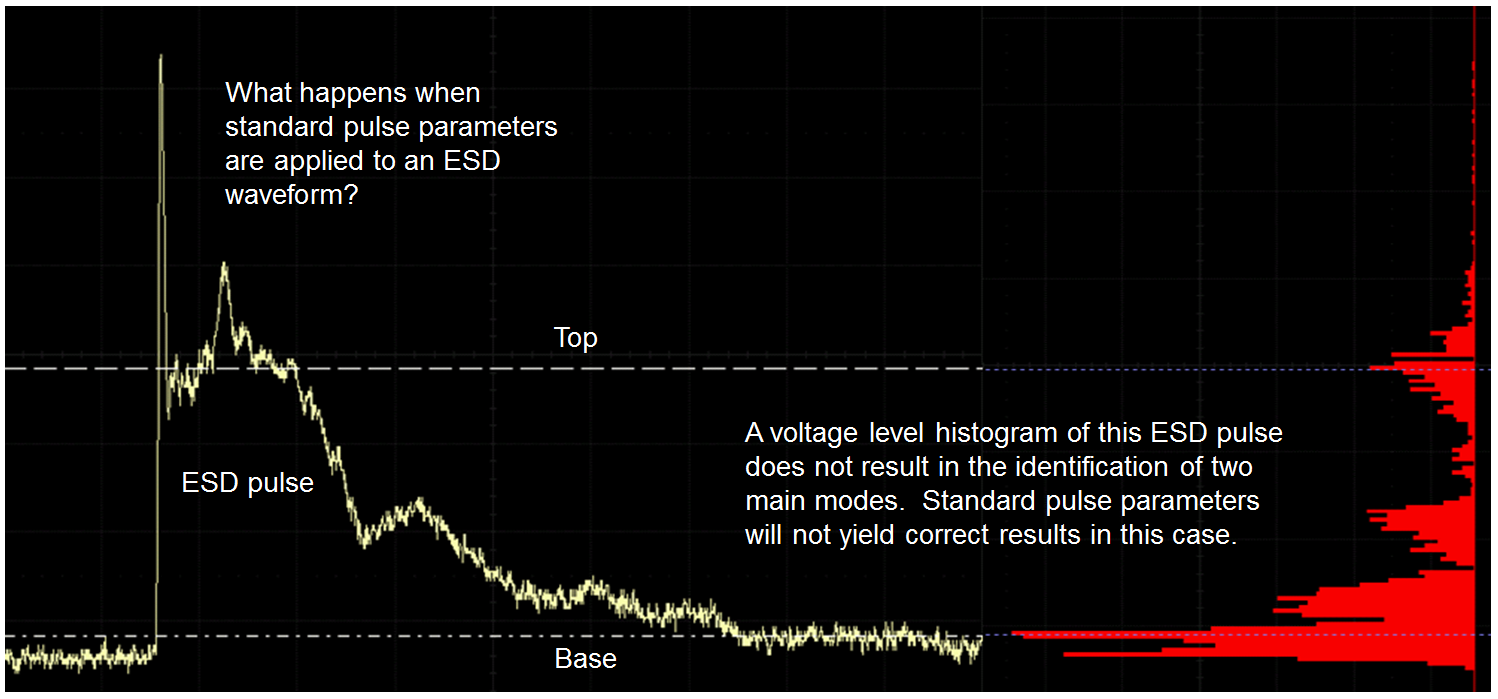
Unfortunately, the top and base are not meaningful for ESD pulse measurements. Let's look at what happens if we apply the IEEE's pulse parameters to an ESD pulse (Figure 3). In the image, we've taken the same voltage histogram of the pulse and superimposed it at right. We can see that the main mode puts a top value right through the center of decay on the ESD pulse, because this is where the largest distribution of voltage values fall at the top end. At the actual peak of the pulse, which is what we're really interested in, there are scant voltage levels shown in the histogram because the pulse decays rapidly after peaking. All oscilloscopes will misinterpret the top value as being the center of decay, and that's a bad result.
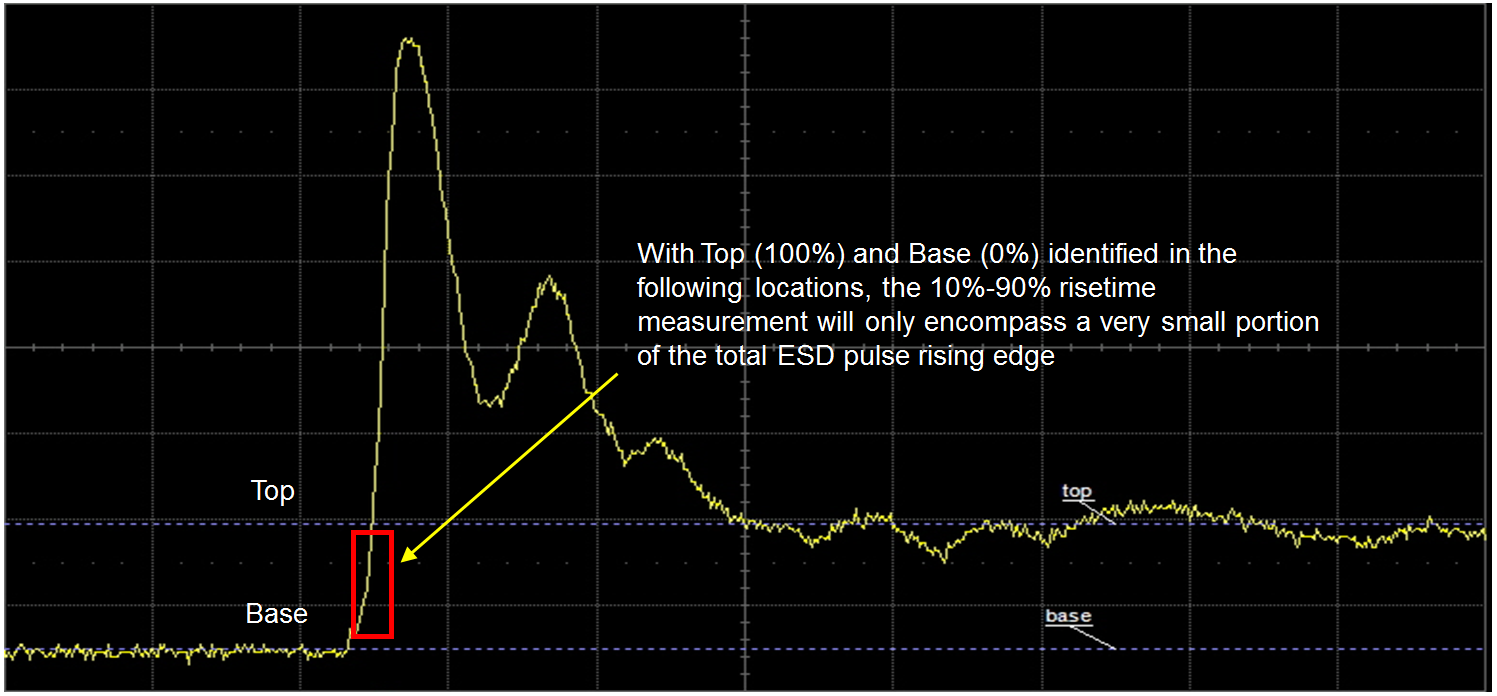
Under these circumstances, what happens to measurement of the 10% and 90% rise time levels? If your oscilloscope misinterprets the top as in Figure 3, then it will subsequently misinterpret the 10% to 90% rise time as seen in Figure 4. We want to see 10% to 90% of the real peak amplitude, but we get only a measurement of 90% of the area exhibiting semi-stable decay.
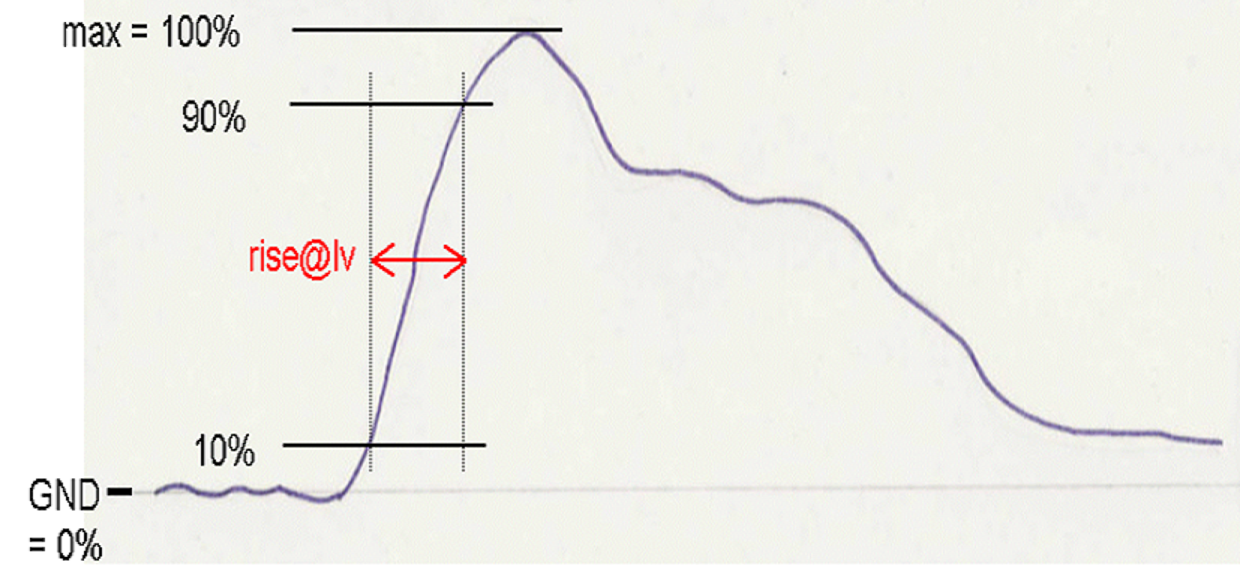
EMC pulse definitions, such as those of the IEC 61000-4-2 standard, use 0% and Maximum instead of Top and Base to calculate the 10% to 90% rise time (Figure 5). By default, virtually all oscilloscopes on the market will use the IEEE Std 181-2003 pulse definitions to perform these measurements. But on the other hand, virtually all modern oscilloscopes will permit the operator to manually override the default threshold settings to measure from 0% (ground) to 100% amplitude. It is these voltage levels that are the proper starting point for determining the 10% to 90% rise time values.
For comparison's sake, using the 10%-90% approach on a representative EMC pulse yielded a rise time measurement of 494 ps. But manually switching the measurement levels to 0%-Maximum results in a measurement of 854 ps, which is the correct result.
By the way, the same caution applies to pulse width measurements, which will be similarly skewed by an oscilloscope's default measurement settings. Oscilloscopes typically default to a 50% value for pulse-width measurements. As with rise time measurements, the level should be manually set to 0%-Maximum to ensure an accurate result.
Copyright © 2020-2026 Teledyne LeCroy. All rights reserved. All original content, including text and photos, is the property of Teledyne LeCroy and cannot be reproduced without expressed written permission.

Accurate ESD pulse measurement depends on using a high enough sampling rate to capture sufficient points on the rising edge for reliable characterization.

Accurate EMC/ESD testing begins with verifying surge and ESD pulse characteristics—such as rise time and bandwidth—using high-speed oscilloscopes before applying them to the DUT.

A real-time oscilloscope can help engineers identify EMI sources and reduce radiated emissions before submitting products for costly FCC compliance testing.