On-Die Power Rail Measurements: Setup and Best Practices
Accurate on-die power rail measurements depend on proper sense-line design, differential probing, and careful test setup at the package level.
Accurate on-die power rail measurements depend on proper sense-line design, differential probing, and careful test setup at the package level.

Transmission line losses—driven by skin effect and dielectric properties—play a critical role in degrading high-speed signal integrity and eye performance.
Transmission line loss directly affects eye diagram quality, with around −12 dB at Nyquist marking the limit before signal integrity rapidly degrades without equalization.
Accurate ESD pulse measurement depends on using a high enough sampling rate to capture sufficient points on the rising edge for reliable characterization.


In continuing our look at ESD/EMC pulse measurements, it would be useful to consider how sampling rate figures into the equation. What sort of sampling rate makes sense to use for capturing an ESD pulse? The answer to that question depends primarily on your pulse's rise time.
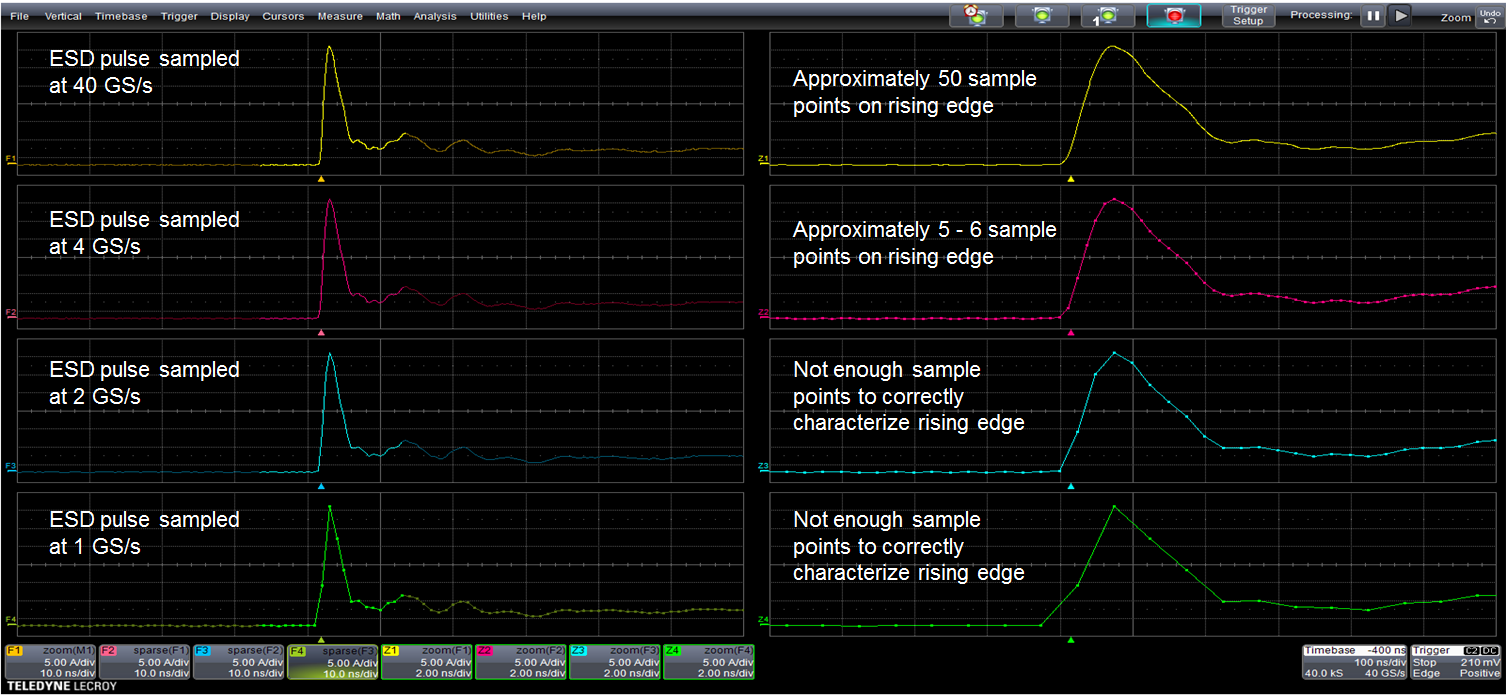
Figure 1 illustrates four acquisitions of the same signal, each at a different sample rate. On the left are the pulse waveforms themselves, and on the right are zoom traces of each pulse.
The top trace, sampled at 40 GS/s, yields about 50 sample points on the rising edge, which makes for a good edge characterization. The other three traces, at 4 GS/s, 2 GS/s, and 1 GS/s, respectively, provide fewer and fewer sample points on the rising edge. We can see that the 1-GS/s trace is quite inadequate for edge characterization.
The rise time measurements on this waveform at the same selection of sample rates shows a degradation with each successive trace. At 40 GS/s, we measure a rise time of 839 ps. The 4-GS/s sampling rate returns a measurement of 865 ps, which represents a 3% measurement error. At the lowest rate of 1 GS/s, the rise time is indeterminate (something less than 1.54 ns) and the oscilloscope is displaying a warning on that channel, which would happen on any commercial oscilloscope. Clearly, that sampling rate is far too slow for this pulse.
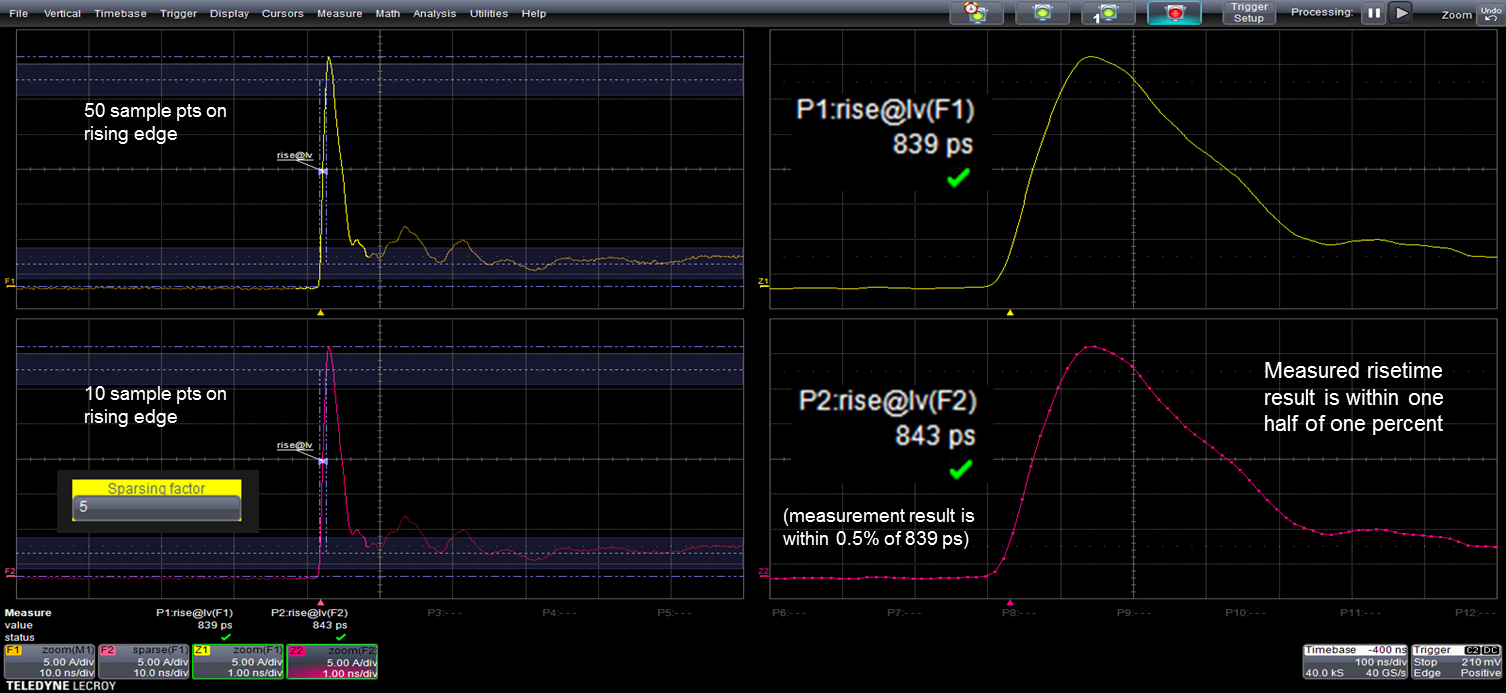
A good rule of thumb is to acquire at least 10 sample points on the rising edge of an ESD pulse. Referring to Figure 2, the trace at upper left with 50 sample points on the rising edge yielded a very accurate rise-time measurement of 839 ps as noted above. The trace at lower left, taken at a sampling rate of 4 GS/s, provided 10 sampling points on the rising edge and a rise-time measurement of 843 ps, which is within 0.5% of actual. The traces on the right are zoom traces showing the sample points.
So a good approach is to start with the oscilloscope at its maximum sampling rate and to reduce that rate until you have about 10 sample points on the rising edge. That will optimize your use of acquisition memory and sampling rate to achieve an accurate rise-time characterization of your ESD pulse.
Copyright © 2020-2026 Teledyne LeCroy. All rights reserved. All original content, including text and photos, is the property of Teledyne LeCroy and cannot be reproduced without expressed written permission.
Copyright © 2020-2026 Teledyne LeCroy. All rights reserved. All original content, including text and photos, is the property of Teledyne LeCroy and cannot be reproduced without expressed written permission.

Standard IEEE pulse definitions can misinterpret fast-decaying ESD pulses, requiring manual threshold adjustments for accurate measurements.

Accurate EMC/ESD testing begins with verifying surge and ESD pulse characteristics—such as rise time and bandwidth—using high-speed oscilloscopes before applying them to the DUT.

A real-time oscilloscope can help engineers identify EMI sources and reduce radiated emissions before submitting products for costly FCC compliance testing.