On-Die Power Rail Measurements: Setup and Best Practices
Accurate on-die power rail measurements depend on proper sense-line design, differential probing, and careful test setup at the package level.
Accurate on-die power rail measurements depend on proper sense-line design, differential probing, and careful test setup at the package level.

Transmission line losses—driven by skin effect and dielectric properties—play a critical role in degrading high-speed signal integrity and eye performance.
Transmission line loss directly affects eye diagram quality, with around −12 dB at Nyquist marking the limit before signal integrity rapidly degrades without equalization.
Transmission line loss directly affects eye diagram quality, with around −12 dB at Nyquist marking the limit before signal integrity rapidly degrades without equalization.

One of the fundamental facts of transmission lines is losses. Any effort to debug the performance of a high-speed serial data link begins there. But it begs an equally fundamental question: How much loss in a transmission line is too much? How do we quantify losses, and what is the connection between attenuation at the Nyquist frequency and the eye diagram? Is there a rule of thumb one might apply, some sort of rough estimate of how much loss might be too much for your channel to bear at a given data rate?
In the previous post in this series, we looked at the loss characteristics of a 20-inch-long FR-4 microstrip differential trace, which we'd simulated using a 3D field solver. Figure 1 reproduces the mixed-mode S parameters for that trace in the form of a plot of losses vs. frequency.
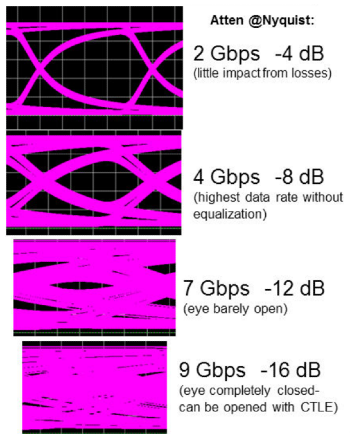
What happens to the eye diagram for that channel at various data rates? Referring to Figure 2, we started with a 2-Gb/s signal, for which the Nyquist frequency is 1 GHz. At 1 GHz, the plot of Figure 1 predicts an insertion loss of about -4 dB, which produced very little distortion of the eye diagram.
When we increase the data rate to 4 Gb/s and a Nyquist frequency of 2 GHz, the plot shows our signal at about -8 dB, which yields a more discernible effect on the eye opening. Moving up to 7 Gb/s, our 3.5-GHz Nyquist frequency results in a -12 db signal. At this point, the eye is barely open. For this particular channel, this is where the insertion losses become overwhelming. Just to drive home the point, the eye diagram is completely collapsed at 9 Gb/s with no discernible opening.
Note that none of these eye diagrams benefited from application of equalization techniques at the receiver. We'll discuss transmit and receive equalization in depth in upcoming posts.
What exactly do these sort of losses do to your signal? Some effects are painfully obvious. For example, there is a monotonic increase in insertion loss; as frequency rises, so do the losses. That's frequency-dependent degradation.
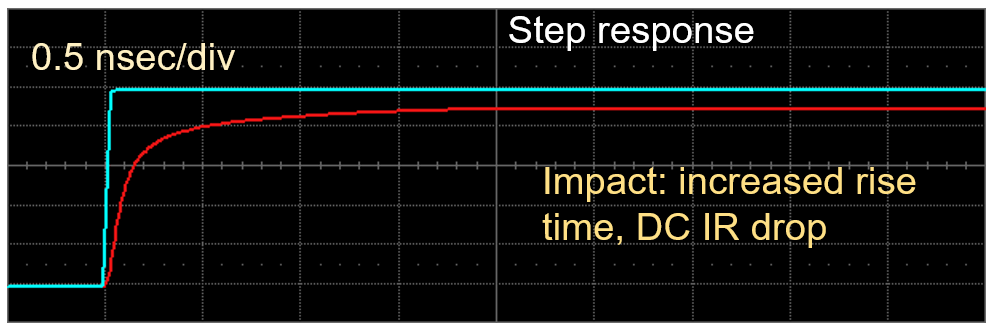
Another effect is rise-time degradation of the receiver step response. In Figure 3, the light blue trace is the signal as transmitted while the red trace is the signal as received. Obviously, the rise time has degraded significantly, mostly because the higher-frequency components of the signal are attenuated much more than are the lower-frequency components. Most of the high-frequency components in a step response are concentrated around the transition point, so it follows that the greater attenuation of those components manifests as rise-time degradation. Obviously, the eye collapses in the vertical direction, but rise-time degradation also causes a collapse in the horizontal direction.
The maximum data rate drops precipitously for a channel with higher losses. Without equalization, you can have up to -12 dB of insertion loss. However, with the application of equalization, it's possible to have as much as -25 dB insertion loss at Nyquist and still have a link that performs quite well.
In another post, we'll work through the effects of inter-symbol interference (ISI) or, as it's sometimes known, ISI jitter.
Copyright © 2020-2026 Teledyne LeCroy. All rights reserved. All original content, including text and photos, is the property of Teledyne LeCroy and cannot be reproduced without expressed written permission.

Accurate on-die power rail measurements depend on proper sense-line design, differential probing, and careful test setup at the package level.

Transmission line losses—driven by skin effect and dielectric properties—play a critical role in degrading high-speed signal integrity and eye performance.

This article explains how PDN design, probing method, and measurement location influence power rail noise—and why board-level measurements can be misleading.

This tutorial explains how quiet I/O probing reveals true on-die rail compression—often far greater than what traditional board-level measurements show.