On-Die Power Rail Measurements: Setup and Best Practices
Accurate on-die power rail measurements depend on proper sense-line design, differential probing, and careful test setup at the package level.
Accurate on-die power rail measurements depend on proper sense-line design, differential probing, and careful test setup at the package level.

Transmission line losses—driven by skin effect and dielectric properties—play a critical role in degrading high-speed signal integrity and eye performance.
Transmission line loss directly affects eye diagram quality, with around −12 dB at Nyquist marking the limit before signal integrity rapidly degrades without equalization.
This guide explains how to measure and validate power rail sequencing in embedded systems to ensure proper startup timing and long-term reliability.


Embedded computing systems generally require multiple supply voltages to deliver power to the microprocessor, memory and other on-board devices. There is usually a 12- or 15-volt DC primary supply, and numerous buck or boost converters working off the primary to help provide various voltages throughout the embedded system. Most microcontrollers have a prescribed order in which the voltages must be applied to prevent problems like lockups, so an area of concern when designing deeply embedded systems is the proper sequencing of power rails as they power up or down. Power management IC’s (PMIC) or power sequencers perform many of the sequencing tasks, but during validation and when troubleshooting, the order and timing of the power sequence should be verified.
Power rail sequence verification is a straightforward test. Connect the oscilloscope probes to each supply rail with the device under test powered off. Set the oscilloscope to trigger on the primary supply, with all traces overlapping on a single grid. The number of rails in your system and the length of time it takes for the sequence to complete determines the number of channels and memory length required, since every rail in a dependent sequence should be probed in a single acquisition. Our 8-channel, 5 Gpts WaveRunner 8000HD oscilloscopes are ideal for this task.
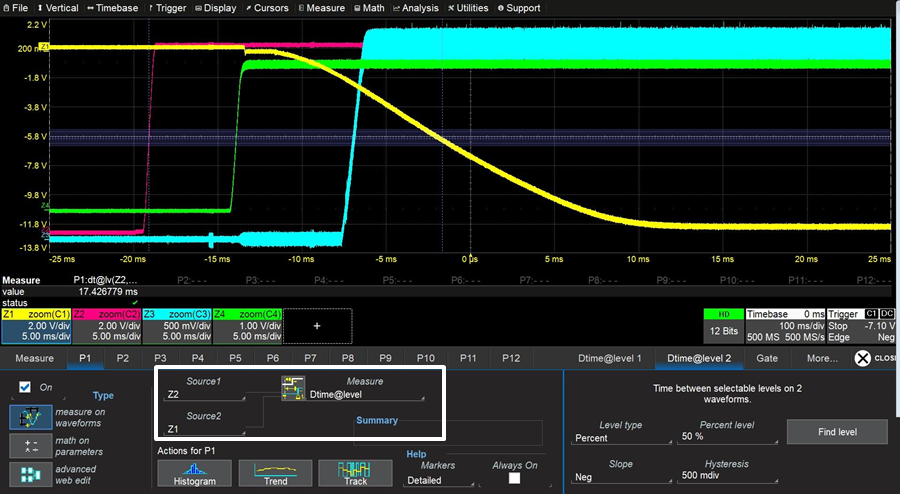
Figure 1 shows an acquisition made on an embedded system with 5 V, 3.3 V, 13 V and -12 V power rails. Triggering in this case was referenced to the -12 V bus, which was the last to come on. Note that in Figure 1, the traces have been displayed on the same grid to clearly show the sequence, with offset added to the Z1(C1) trace so that it overlaps the others. The “on” time for each trace is the point at which it reaches its minimum effective voltage. For C1, that occurs around 10 ms.
What is expected is that the voltage levels should rise or fall monotonically in the desired order at the desired time intervals. In this example, the 13 V rail (magenta trace) turns on before the others, followed by the 5 V rail (green trace), then the 3.3 V rail (blue trace) and finally the -12 V rail (yellow trace). The time delay between each power rail coming on is measured with cursors. Figure 1 shows the delay between the first pair of 13 V and 5 V buses measured at 5.18 ms. Measuring the delta from the previous rails is repeated for each rail in sequence.
In the real world, embedded systems don't turn on just once. They are turned on and off multiple times, perhaps many thousands of times over the life cycle of the product, so a robust rail sequence must be able to maintain the proper order and delay over many power on cycles. Whereas a cursor measurement will verify a single sequence, the oscilloscope’s Parameter Compare Pass/Fail test capability will enable you to do some reliability testing.
The Pass/Fail setup begins with setting up the parameters that will used as the basis for comparison. For this test, configure a parameter using delta time at level (Dtime@level), which measures the time difference between two traces at a selected voltage threshold and slope. The last measurement on traces Z1 and Z2 is 17.4 ms, shown in the Measure table under P1 (click on the image to expand it).
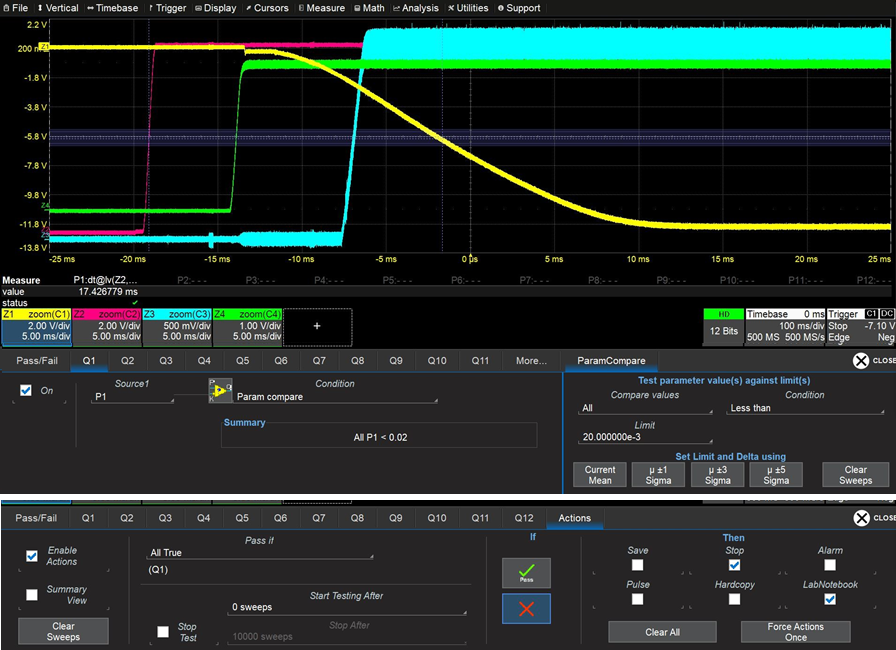
The next step is to setup a Pass/Fail test that compares the measured delta between Z2 coming on and Z1 coming on to an upper limit of 20 ms, as shown in the composite image in Figure 3. The Action dialog specifies that the device “Passes if…” Q1 is All True— that is, all P1 Dtime@level values are measured at less than 20 ms, meaning the -12 V rail always comes on within 20 ms of the 13 V rail before it. If a measured value fails the test (Dtime@level is greater than 20 ms), then the oscilloscope action is to stop the acquisition and hold the failed test on screen for inspection. It also generates a LabNotebook report, which saves all the data and measurements for further analysis.
Copyright © 2020-2026 Teledyne LeCroy. All rights reserved. All original content, including text and photos, is the property of Teledyne LeCroy and cannot be reproduced without expressed written permission.

This introduction explores how to debug complex embedded systems by time-correlating diverse signals across power, digital, and analog domains.

This guide explains how to capture and correlate low- and high-speed events in embedded systems by balancing sample rate, memory depth, and measurement techniques.

Use serial decoding and digital-to-analog conversion techniques to track inaccessible sensor data and correlate it with system behavior in embedded designs.