On-Die Power Rail Measurements: Setup and Best Practices
Accurate on-die power rail measurements depend on proper sense-line design, differential probing, and careful test setup at the package level.
Accurate on-die power rail measurements depend on proper sense-line design, differential probing, and careful test setup at the package level.

Transmission line losses—driven by skin effect and dielectric properties—play a critical role in degrading high-speed signal integrity and eye performance.
Transmission line loss directly affects eye diagram quality, with around −12 dB at Nyquist marking the limit before signal integrity rapidly degrades without equalization.
Characterizing rail transient response and mutual aggressor noise helps quantify droop, ripple, and recovery behavior in power delivery networks.


A third type of noise found in PDNs is what we call mutual aggressors, which is crosstalk coupling from one component of the PDN onto another.
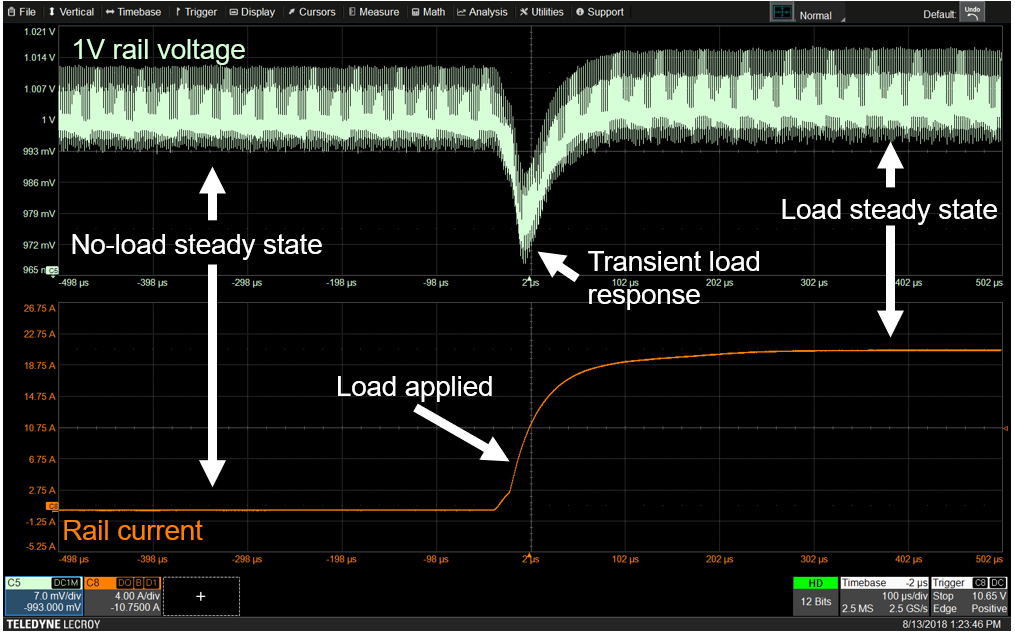
An obvious example is a load step in the PDA, where something in the system being turned on pulls current from the VRM that supplies a rail. In Figure 1, you can see how the output voltage of the VRM supplying a 1 V rail droops in response to a load step before it recovers. This is still noise: it is a signal variation that we're not expecting and don't want.
We want to be able to characterize that noise, because too much droop could affect the operation of other components that are already consuming power from that device.
In order to do so, we’re going to measure the rail transient response to the load application. We need only look at two signals: the voltage and the current on the rail of interest. Figure 1 shows the voltage on C5 (the green trace) and the current on C8 (the orange trace).
First, we’ll assess what the rail looked like before applying the load:
Then, we’ll look at the transient load response. When we see the current increase after applying the load, we’ll measure:
It's essentially a measure of steady-state behavior before the load, dynamic behavior during, and steady-state behavior afterwards.
There are three approaches to making those measurements with an oscilloscope, which we’ll discuss in order of increasing sophistication.
For all these examples, we’ll acquire a 1 V rail over the course of a millisecond, applying a step right in the middle. The acquisition shows 500 microseconds before and 500 microseconds after the load application.
A fairly basic approach to measuring rail transient response with an oscilloscope is to apply cursors.
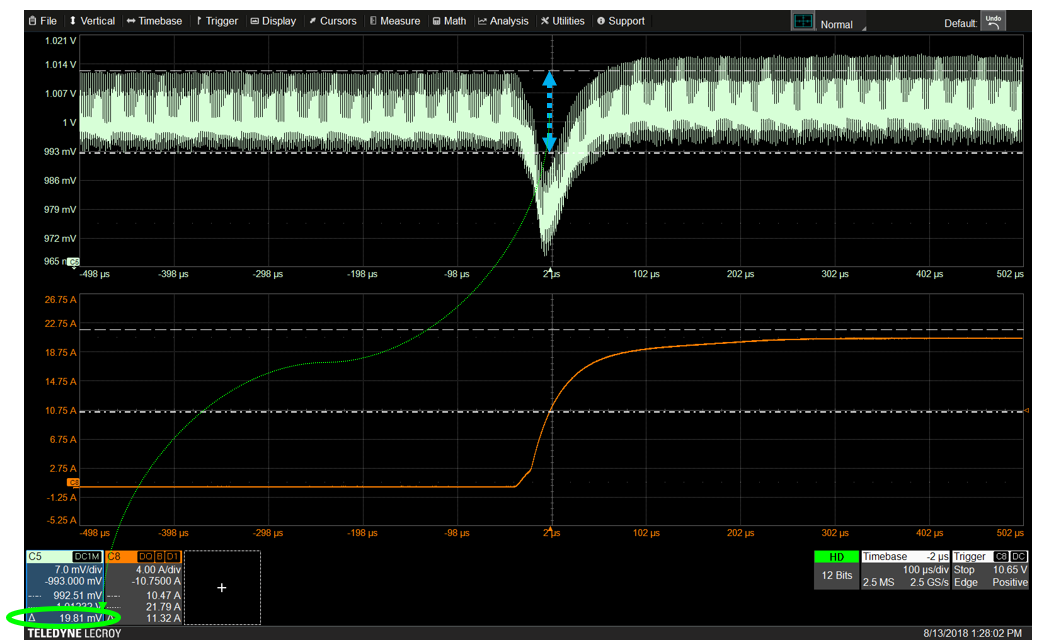
To see what the ripple was on the rail in the no-load condition, you simply place vertical cursors on the observed peaks of the voltage trace--one cursor at the top and one cursor at the bottom of the trace—and subtract. Cursors in Teledyne LeCroy oscilloscopes will automatically calculate the difference. In Figure 3, the cursors are showing 19.81 mV of ripple.

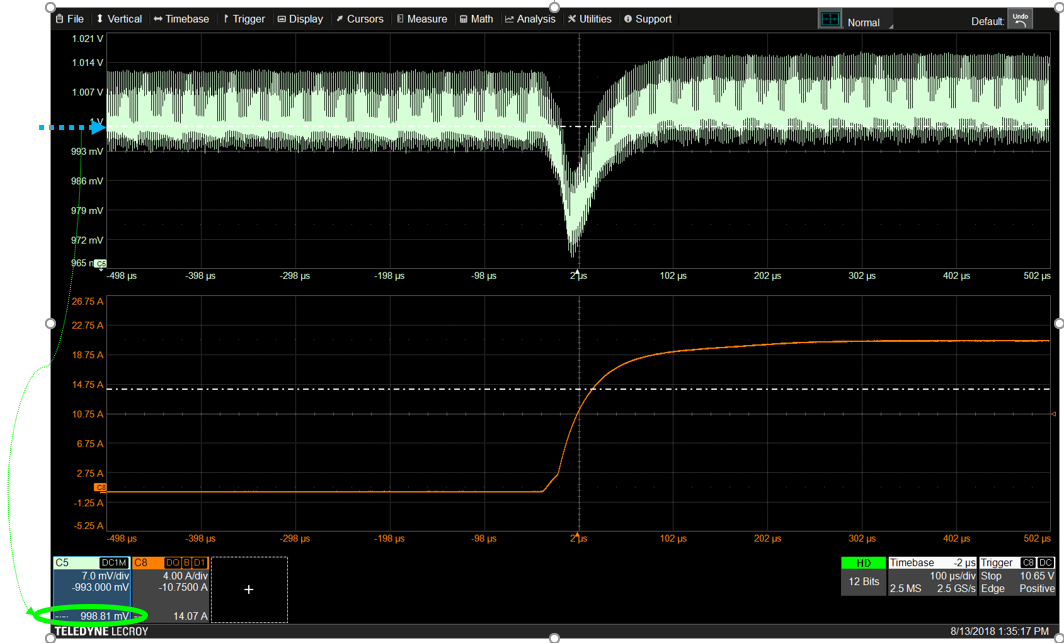
Mean voltage is harder to measure with cursors. You can look to see where the voltage trace is the most dense and put a vertical cursor there, but that’s not a very precise way of measuring the mean. Figure 4 shows a mean voltage of 999.81 mV, fairly close to the expected 1 V on the rail.
Next, one does the same to measure the ripple and mean in the steady state after the load. However, because the vertical cursor measurements encompass the entire acquisition and still include values from the other stages in the load response, that mean does not accurately distinguish between the pre-load, load and post-load states.
Using cursors is also more difficult when looking at the dynamic behavior. To estimate how much the signal has drooped, we could measure from the dense area “mean” to the lower peak, about 31 mV in Figure 5, but again, that measurement includes all the ripple.
To estimate recovery time (the time taken to return to a certain percentage of the final voltage level), you would place one horizontal cursor where the current starts to rise as the load was applied, and the other where the voltage has recovered to the percent you want to measure (Figure 6).
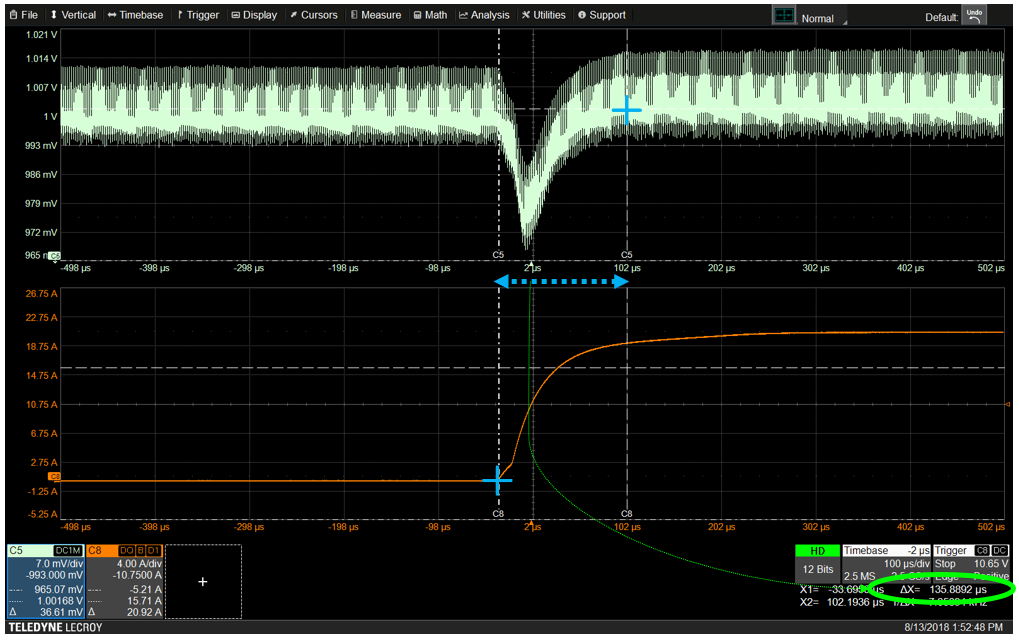
Here, we’ve chosen to measure recovery to 10% of droop (which was 31 mV), so the second horizontal cursor goes where the voltage (C5) is 3.1 mV down from the “steady state” mean after the load application.
Settling time measurement is done by placing one horizontal cursor where the current begins to rise and the other where the voltage has reached the final level.
A more sophisticated way of measuring rail transient response on an oscilloscope is to use zooms and measurement parameters. Measuring the zooms limits the measurements to just one region of the trace, such as the pre-load state, and also give better visibility into the high frequency behavior.
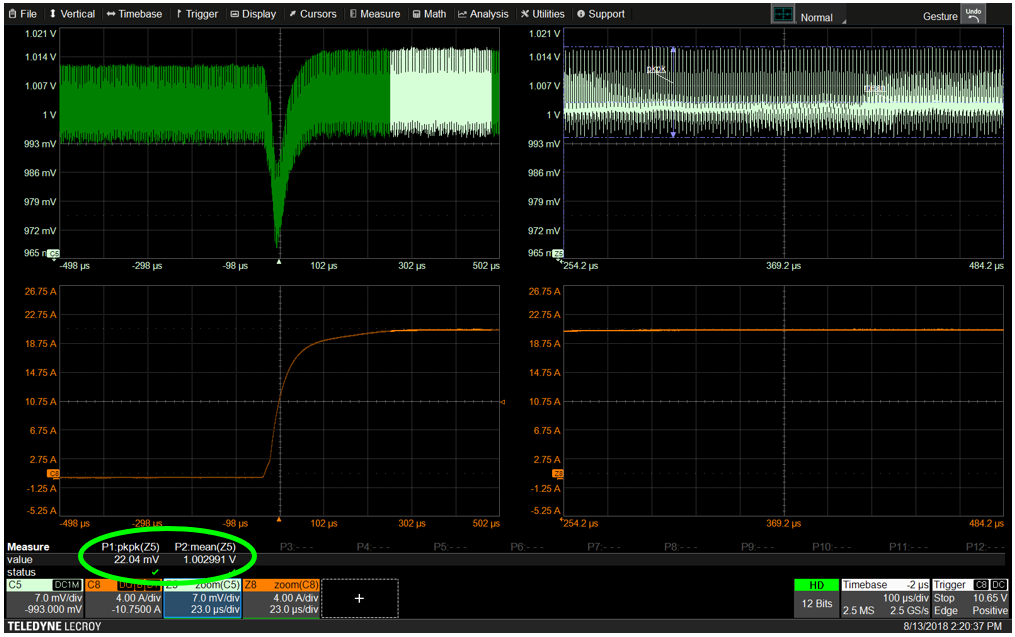
In Figure 7, the two zooms on the right show just the pre-load voltage (light green) and pre-load current (bright orange) from the traces on the left. Clearly seeing that the current has not yet started to rise confirms we are measuring the right section of the waveform. You can then apply the peak-peak parameter to the voltage zoom (Z5) to determine the amount of ripple before the load application, 19.88 mV in our example, and the mean parameter to the same to calculate the actual mean voltage, 999.665 mV.

Simply shifting the zoomed region will apply those same measurements to the post-load application, or you could create new zooms of the post-load waveform to retain the pre-load zooms and measurements on the display. In Figure 8, we can see both the ripple (peak-peak) and mean voltage has gone up a bit in the post-load state, to 22.04 mV and 1 V respectively.
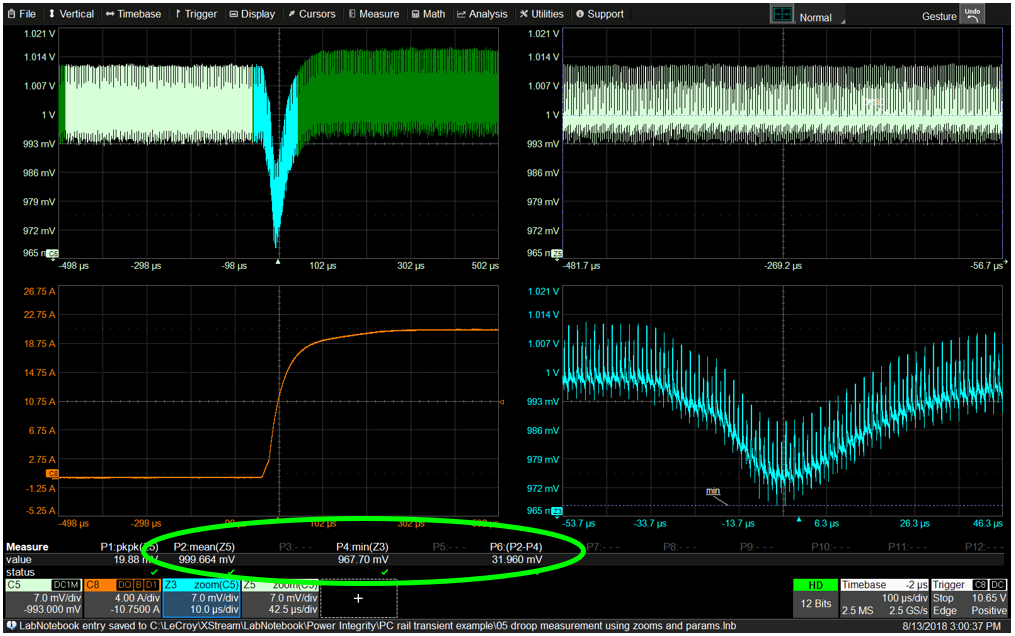
Droop could be measured by adding a zoom of the voltage during the load step (Z3 in blue), measuring the min of that, and using parameter math to subtract the load min from the pre-load mean (Figure 9). Again, this method is still somewhat unsatisfying, because some of the ripple is folded into the droop measurement.
The recovery and settling time measurements would be done as described above with cursors placed on the zooms, where it's a bit easier to estimate their placement, because we've zoomed in and can better see the high-frequency behavior.
A better way to do all this is to use our Digital Power Management software, which gives us vastly improved measurement capabilities and better insight.
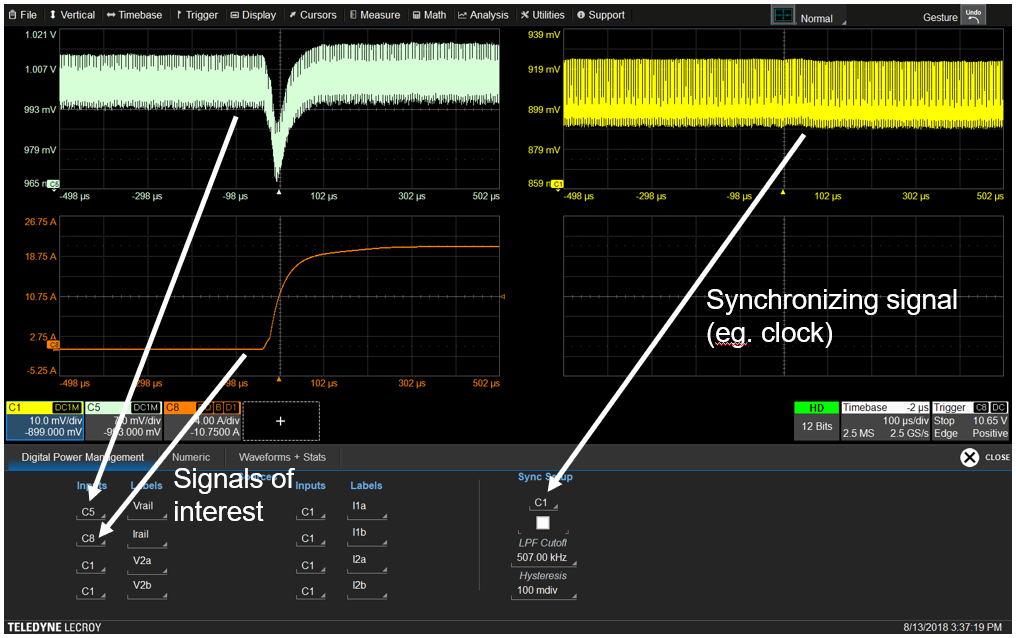
One of the reasons the software can do this is that it allows you to measure the signals of interest on a per-cycle basis to see how they vary according to the behavior of a known aggressor. You can tell it, "I know I've got a PWM clock switching frequency that's likely inducing the ripple, so I’m going to synchronize my measurements to that guy to see the per-cycle variations in the signals" (Figure 10).
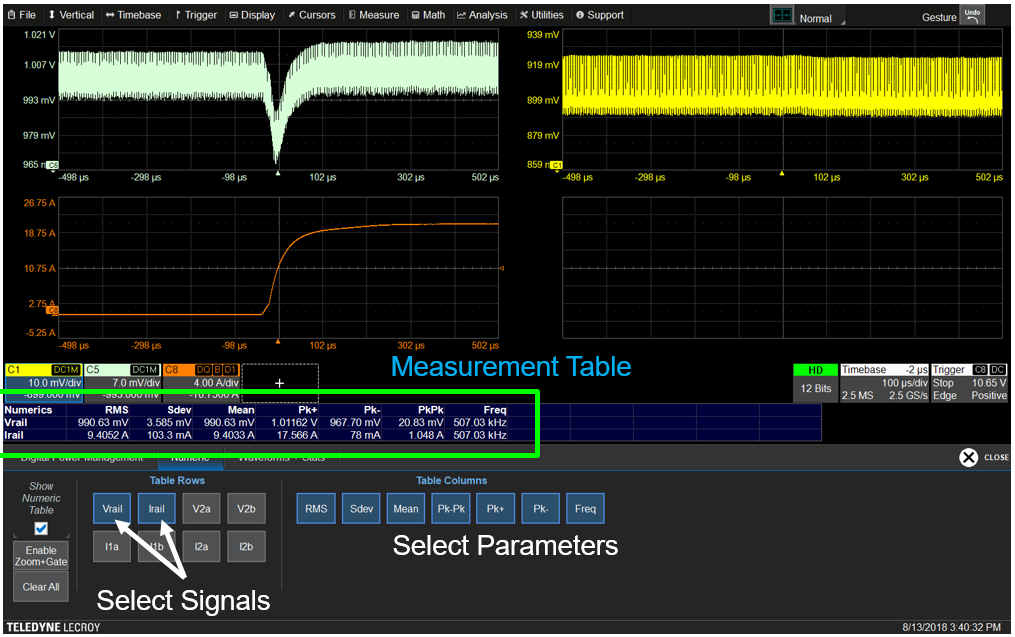
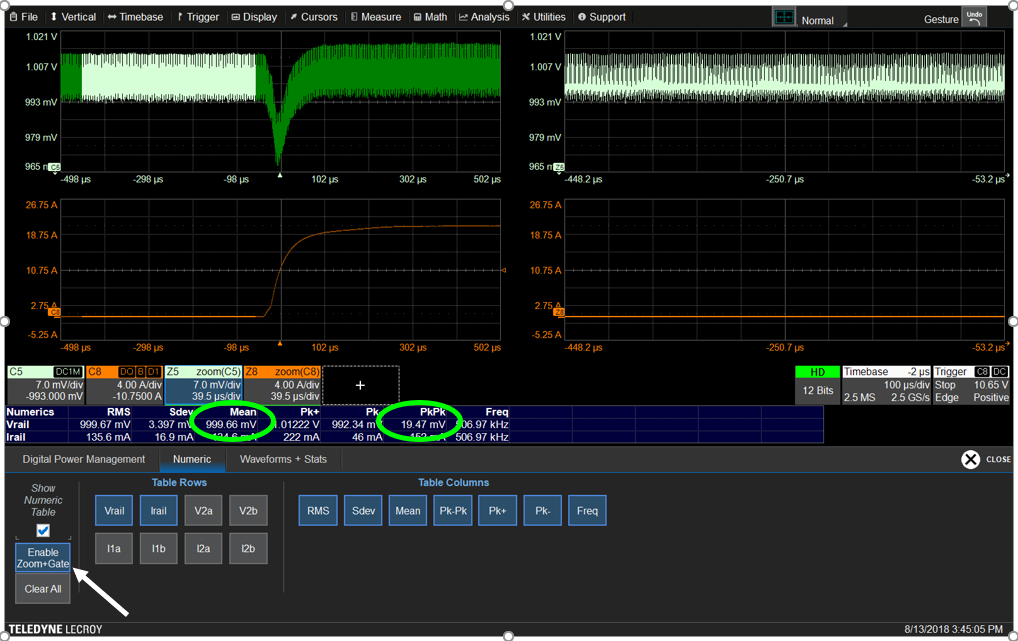
You can then pick the two signals of interest--the voltage (Vrail) and the current (Irail)--and the software will automatically calculate the per-cycle RMS, deviation mean, positive and negative peaks, and peak-peak of these two signals, because it is designed specifically for digital power measurements, like rail transient response (Figure 11). Just select the measurements you want to view to add them to the table.
Enabling Zoom+Gate (Figure 12) automatically creates new zooms of each trace and gates all the measurements to the same zoom region. All traces and zooms are synchronized, so simply panning either the signal or the zoom trace changes the zoom region and will update the measurements on all the signals simultaneously.
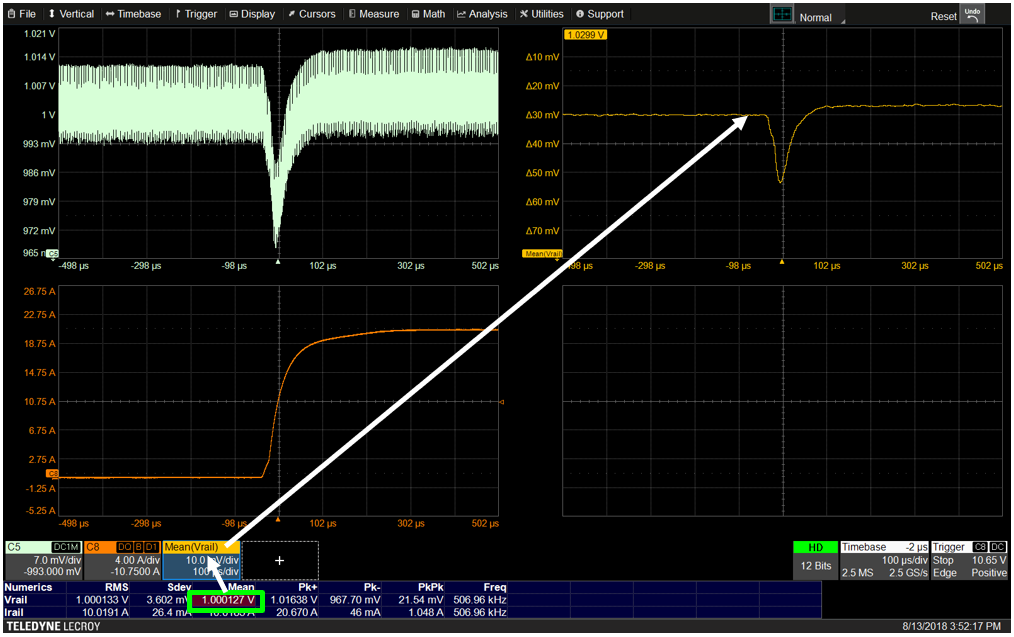
And, if you click on a measurement in the table, the software will plot the value of that measurement for each cycle as a per-cycle Waveform (Figure 13). By taking the mean voltage of each cycle, the software has essentially removed the high-frequency ripple effect from the signals of interest. The parameters now apply to the per-cycle Waveform, so you can really look at how just the mean voltage varies across time.
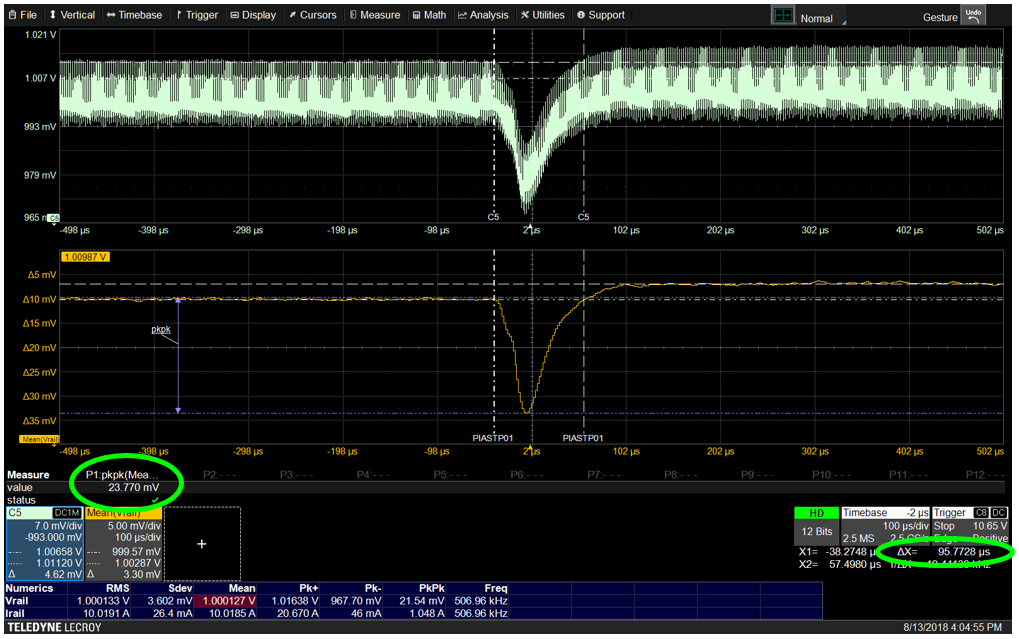
This has some obvious benefits to doing things like measuring the droop, because now you can measure the peak-peak droop without the ripple incorporated. The 23.7 mV droop in the per-cycle Waveform is a significantly smaller number than the 31 mV previously calculated “by hand” using cursors, because it doesn’t include any of this ripple.
It’s also easier to measure things like settling time and recovery time, because the start and end point of the measurements are easier to pick out of the waveform when you don’t have to to eyeball where the voltage mean is inside of all of that ripple.
Copyright © 2020-2026 Teledyne LeCroy. All rights reserved. All original content, including text and photos, is the property of Teledyne LeCroy and cannot be reproduced without expressed written permission.

Accurate on-die power rail measurements depend on proper sense-line design, differential probing, and careful test setup at the package level.

Transmission line losses—driven by skin effect and dielectric properties—play a critical role in degrading high-speed signal integrity and eye performance.

Transmission line loss directly affects eye diagram quality, with around −12 dB at Nyquist marking the limit before signal integrity rapidly degrades without equalization.

This article explains how PDN design, probing method, and measurement location influence power rail noise—and why board-level measurements can be misleading.